The way many do observability right now is expensive and leads to massive vendor lock-in. OpenTelemetry (OTel) is the industry’s answer to this problem; an answer that gives you full control and flexibility over your telemetry.
In this article, we break down the OpenTelemetry architecture, from the agent to the OTel Collector, and explain why OTel becomes a “must-have” for DevOps teams.
Part 1 – What is OpenTelemetry and why do people care?
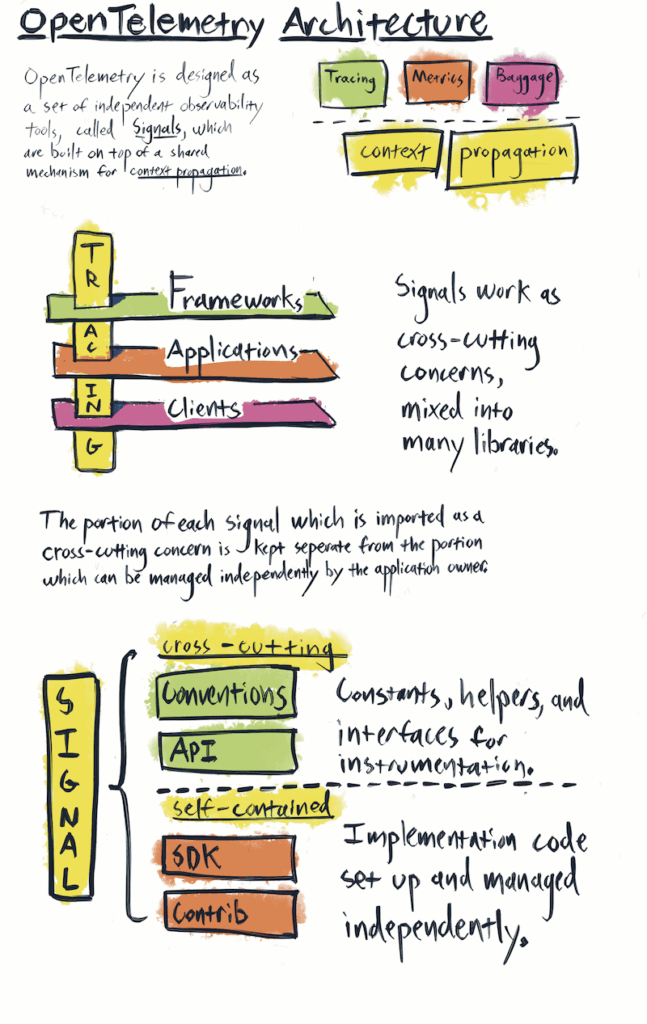
OpenTelemetry is an open-source observability framework that standardizes how telemetry data – logs, metrics, and traces – is collected and exported. OpenTelemetry is coming up more and more often in architecture and observability discussions. It isn’t another SaaS tool you buy, it isn’t just another dashboard. It’s something bigger. That’s why it’s already the second most active project in the Cloud Native Computing Foundation (CNCF), right after Kubernetes. It defines a standard for collecting, processing, and exporting telemetry datalogs, metrics, and traces – using a single set of SDKs and protocols, including OTLP (OpenTelemetry Protocol).
The main reason teams adopt it is to avoid vendor lock-in. In the past, tools like New Relic or Elastic APM required you to use their agents. Switching vendors meant replacing agents, changing code, and rebuilding dashboards. With OpenTelemetry, you instrument your services once using a standard. Then you decide where the data goes – Elastic, Grafana, Datadog, New Relic – without touching the services again.
OpenTelemetry is both a standard (for describing metrics, logs, and traces) and a set of tools (SDKs, agents, and collectors that use that standard). So when people ask if it’s a protocol or a product, the right answer is: both.
Vendors are adopting it too. Datadog, Elastic, New Relic — they all support OpenTelemetry now, because they understand this is the direction the industry is going. Customers want to use one common framework, not be stuck with a proprietary one.
So, how does OpenTelemetry work?
- NOTE: In this article, we’ll follow a fictional SaaS data platform. Each tenant uploads files and sometimes requests “rehydration” jobs — background processes that restore archived data into active storage for analysis. This workflow serves as our running example: we’ll show how OpenTelemetry captures both technical telemetry and tenant-level business metrics, tracing a single job end-to-end across services.
Part 2 – Complete OpenTelemetry Architecture: From Agent to Backend
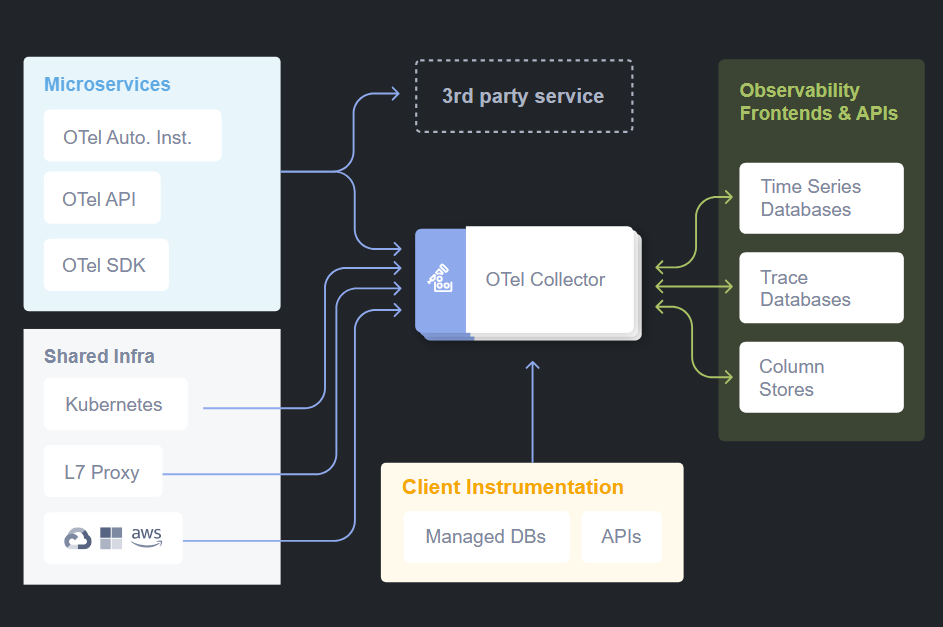
OpenTelemetry works as a telemetry pipeline between your services and monitoring backends. The complete architecture includes three main components:
- OpenTelemetry Agent (or SDK)
- OpenTelemetry Protocol (OTLP)
- OpenTelemetry Collector
The Core Pipeline
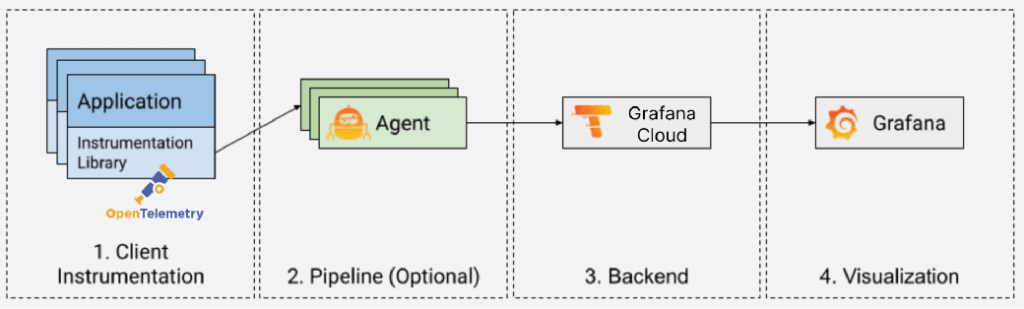
The way OpenTelemetry works is pretty straightforward once you see it as a pipeline. On one side you have your services generating telemetry data. On the other side you have the backends where you want to store, analyze, and visualize that data. In between, you place the agent and the collector. So the flow looks like this:
Service → OTel Agent → OTel Collector → Backend (Elastic, Grafana, etc.)That’s the core architecture.
OpenTelemetry Agent: Data Collection at the Source
Most teams start by adding the OTel agent to their Dockerfile, replacing the old agent. You update environment variables, not application code.
Auto-instrumentation: Quick Start
This setup gives you auto-instrumentation: basic telemetry out of the box – request counts, latencies, errors, throughput – without writing code.
Custom Instrumentation: Business Context
Auto-instrumentation gives technical data, but not business insights. It can’t track things like how long a rehydration takes or how many files a tenant uploads. The agent doesn’t know your business logic.
For instance, in our rehydration workflow, you could instrument spans for each step — rehydration.requested, rehydration.data_fetch, rehydration.validate, rehydration.complete — and attach attributes like tenant ID, dataset size, and SLA tier. That way, dashboards can show which tenants are running the most jobs, which datasets are taking longest, and where bottlenecks occur.
To get business-level data, developers add spans, counters, and tags in the code. For example, in the File Receiver service, you can tag each upload with tenant ID, device type, file extension, etc.
With that, dashboards can show which tenants send the most files, what types they are, and how usage varies.
The pattern is simple:
Start with auto-instrumentation → Add custom metrics where business context is needed.=OpenTelemetry Collector: The Central Intelligence
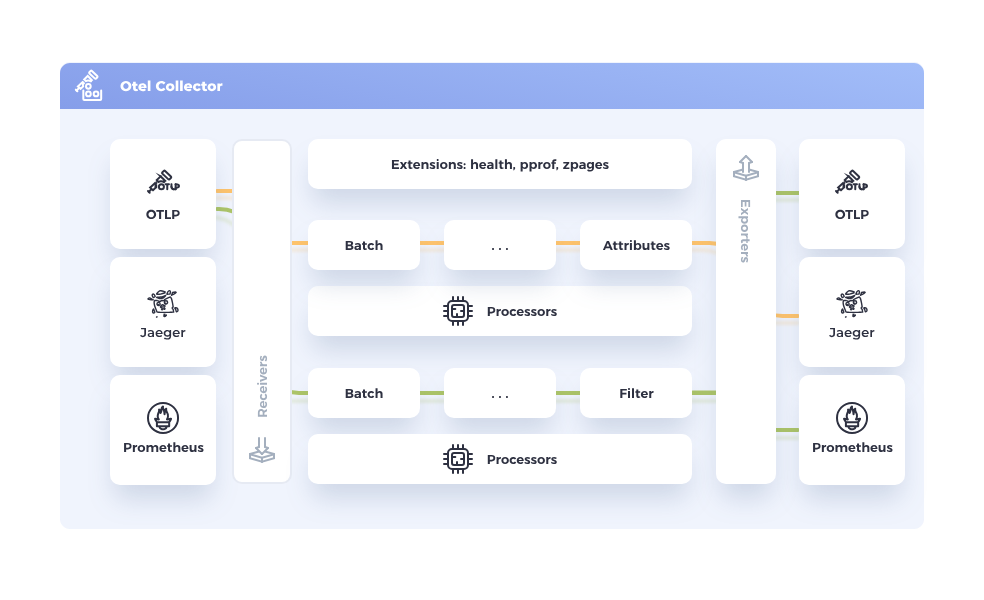
The Collector is the other critical piece in the pipeline. It’s what makes OpenTelemetry truly vendor neutral. Services send all their telemetry to the Collector, and then the Collector takes care of forwarding it to backends.
The Collector can enrich the data, buffer it if the backend is overloaded, retry if there are network issues, and most importantly, fan it out to multiple destinations. That means today you can still send your data to Elastic, but at the same time forward it to Prometheus and Grafana. Once you are confident in Grafana dashboards, you just switch off Elastic. The services don’t need to change anything.
OpenTelemetry collectors can be deployed in multiple patterns: as sidecars, as DaemonSets, within the same container, or as separate services. The deployment pattern depends on the specific use case and infrastructure requirements.
Buffering and Resilience
One detail worth calling out is buffering. With vendor agents, if the backend went down or struggled under load, data was simply lost. Yet, the OTel Collector can buffer data temporarily and resend it when the backend is ready.
The Collector supports both in-memory and persistent disk-based buffering using mechanisms like persistent queues and retry logic with exponential backoff. This means data is protected even if the Collector itself restarts.
Multi-Protocol and Vendor-Neutral Routing
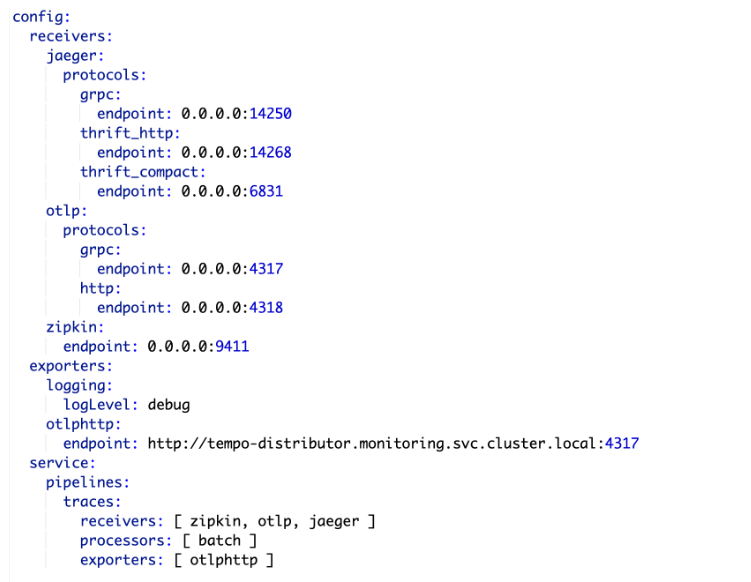
The Collector is the central component of OTEL: For example, one Collector instance can receive Zipkin, Jaeger, and OTLP traces, merge them, and send them to Grafana Tempo.
| Feature | Why It Matters |
| Multi-protocol ingestion | Supports OTLP, Jaeger, Zipkin, Prometheus, etc. |
| Vendor-neutral routing | Can send data to open-source and commercial backends |
| Horizontal scalability | Handles high-throughput telemetry workloads |
| Unified agent model | Replaces multiple per-vendor agents with one Collector |
Distributed Tracing: Connecting the Dots
Metrics tell you how much of something is happening.
Logs tell you what happened at a specific point.
Traces are what connect everything together.
Understanding Traces and Spans
Take a transaction that starts in Service A, which then calls Service B and C. Without tracing, you’d only see disconnected logs from each service. With OpenTelemetry, you see the whole chain stitched together.
Traces are made up of spans. Each span is a single step: a database query, an API call, a message on Kafka. When you line them up, you see the full journey from start to finish.
What are spans? → Individual operations in a trace.
What is a trace ID? → A unique identifier passed through services for correlation.
Making Traces Meaningful
Auto-instrumentation covers the common cases — APIs, DB queries — but for workflows unique to your business you add custom spans. For example, you might create a span for “file uploaded to external provider” or “rehydration step completed.”
Taking the rehydration example further, a single tenant’s job might pass through multiple services: File Receiver → Rehydration Orchestrator → Storage Service → Validator. OpenTelemetry traces stitch all these steps together, so you can see exactly how long each step took and identify where delays happen — all tagged by tenant, dataset, and SLA tier.
Serverless Environments
Traces are even more critical in serverless environments. When you’re dealing with thousands of short-lived functions (Lambdas, Azure Functions), debugging without tracing is almost impossible. With OTel, you can follow a transaction across many ephemeral functions.
Correlation with Logs
Every trace has identifiers called traceparent and tracestate. These flow through all the services involved in a transaction and can be added to logs. That means when production support needs to investigate an issue, they don’t have to piece logs together manually — they can search by a trace ID and see the full path: which services were called, how long each step took, and where the failure happened. In practice, this connects logs, metrics, and traces into a single view of the same event.
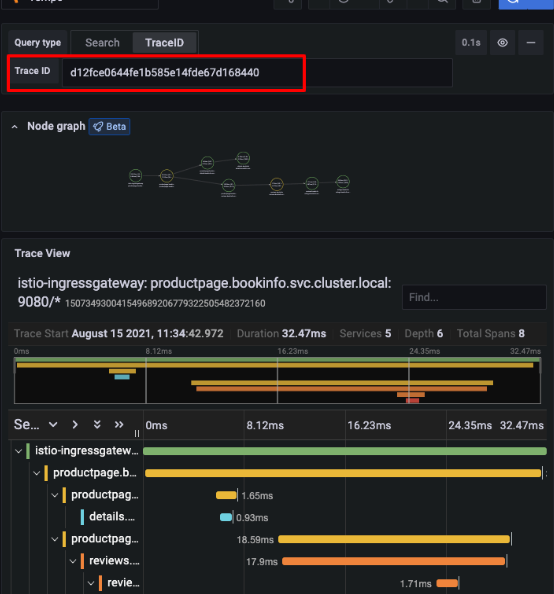
Example in Practice
Let’s assume you had a transaction that failed during a file upload. With OTel tracing, you could see the call path:
File Receiver → File Manager → external provider.The trace showed that the external provider call took 37 seconds and failed. That gives you the evidence to talk to the provider and resolve the issue. Without tracing, it would have been a complete guesswork across various teams
Integration with Grafana Tools
Grafana Tempo
Grafana Tempo is a scalable distributed tracing backend that integrates with Grafana dashboards.
With Tempo and OTEL:
- You can store traces without indexing them.
- You can jump directly from logs to traces in Grafana.
Loki – Log Aggregation and Trace Awareness
Grafana Loki stores and queries logs. When paired with OTEL and Tempo:
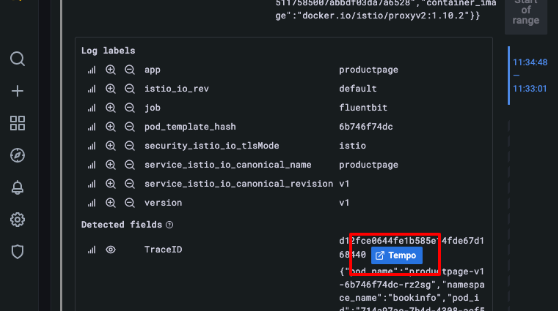
- Logs can be tagged with a traceId.
- The traceId matches Tempo IDs, and you can jump from log to trace with one click.
Tempo + Loki Integration
Because Tempo and Loki share trace IDs, you can start in logs and jump to traces for deep troubleshooting.
When using Grafana, OpenTelemetry integrates natively with tools like Tempo and Loki. Logs collected via Loki can be tagged with a traceId, allowing you to jump directly from a log line to a distributed trace in Tempo — dramatically improving incident response workflows.
Part 3 – Business Metrics and Custom Instrumentation
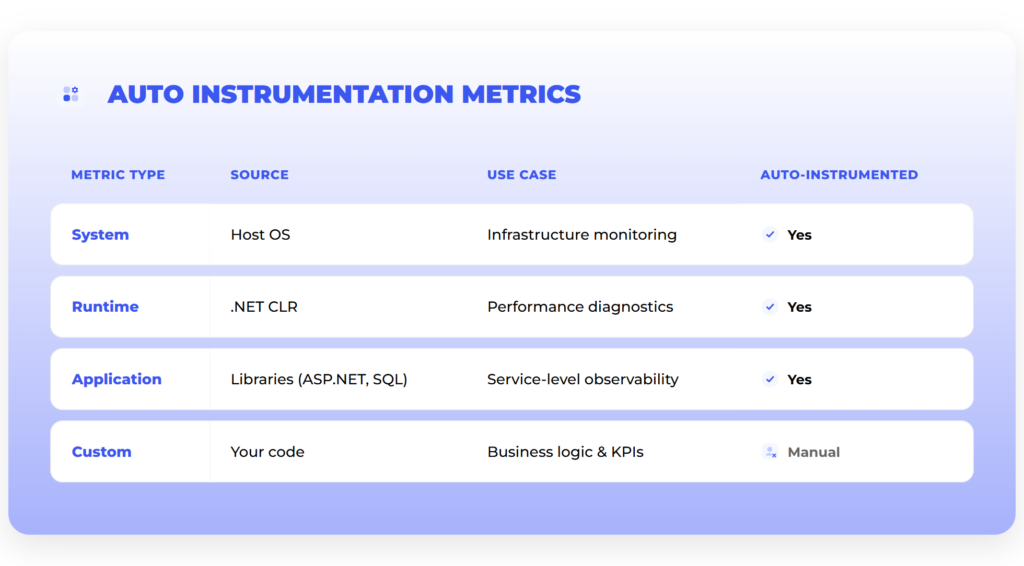
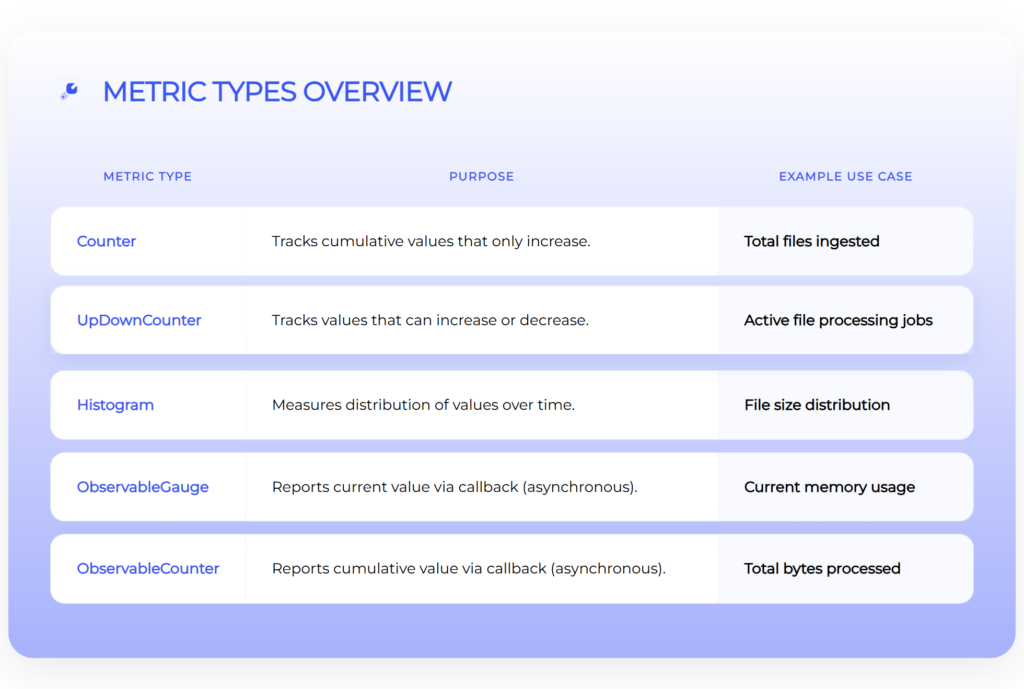
Image source: internal
One key reason teams adopt OpenTelemetry is to track business metrics, not just infrastructure data. While traditionally you measure those, too, with OTel it’s much faster. And, what’s probably even more important, as OpenTelemetry becomes a standard, teams will measure the metrics in a more standardized way – again, without vendor lock-in.
OpenTelemetry Metric Types
OTel defines several types of metrics:
| Metric | Description |
| Counters | Totals (e.g. files ingested) |
| Up-down counters | Values that go up/down (e.g. active jobs) |
| Histograms | Distributions (e.g. file sizes, request times) |
| Observable gauges | Current values (e.g. memory usage) |
| Observable counters | Values reported externally (e.g. bytes processed) |
Auto vs Custom Metrics in Practice
Auto-instrumentation gives basic system data. But for business insights — like tenant behavior or workflow stats — you need custom metrics added in the code.
File Receiver Example
Take the File Receiver service. Its job is to accept files from devices or from the UI. With OTel, you can add a counter for every file that comes in. But there’s more – you can also tag each upload with metadata:
- tenant ID
- device type
- file extension
- group type
- source
- tier
Similarly, rehydration jobs can generate business metrics. For example:
rehydration_jobs_total{tenant="tenantA"}counts how many rehydrations a tenant requested.rehydration_duration_seconds_bucket{tenant="tenantB"}shows latency distributions.
This allows product and operations teams to track tenant behavior over time, correlate usage with costs, and plan capacity — all from the same OpenTelemetry pipeline.
Now, instead of just “X files uploaded,” it’s easier to see:
- which tenant is uploading the most,
- what types of files are coming in,
- how different groups or tiers behave,
- which devices are most active.
Why Tagging Matters
Without tags, you only get totals. With tags, you can break data down — by tenant, device, file type — and get dashboards that show real product usage.
Business Visibility as the Next Step
Infrastructure telemetry tells you if the system is healthy. Business telemetry tells you if the product is delivering value.
For example:
- “How many devices sent files in the last 24 hours?”
- “What’s the throughput per tenant group?”
With OTel, you can track both — in one system.
Part 4 – Multi-Technology Stack
Multi-Tech Stack Tracing
OTEL can merge telemetry from different languages and frameworks into one trace timeline.
Example setup:
- Java (Spring Boot 2.7.5): OTEL instrumentation for HTTP, MongoDB, Kafka
- Node.js: OTEL instrumentation for HTTP, MongoDB, RabbitMQ
- Istio Service Mesh: Zipkin-compatible traces from Envoy Proxy
Supported Technologies
OpenTelemetry supports a wide array of technologies out of the box, like:
- Messaging systems: Kafka, AMQP, RabbitMQ
- Databases: MongoDB, SQL databases (query capture)
- HTTP: Both client and server instrumentation
- Service Meshes: Istio, Envoy Proxy
Thanks to that, you can unify observability across various environments.
Part 5 – How to migrate to OpenTelemetry?
The idea of adopting OpenTelemetry can sound like a big migration project, but in practice, teams don’t do it all at once. Nobody wants to risk breaking observability in production. So the way it usually happens is in phases, step by step, with no “big bang” cutover.
Phase 1 – Swap the Agent
Start by swapping the Elastic agent for the OTel agent in your Dockerfile. The app code stays the same. You just update config and environment variables. Services still send data to, let’s say, Elastic, but now through OTel. This breaks the first dependency — you’re no longer tied to the Elastic agent.
Phase 2 – Add the Collector
Next, route data to the OTel Collector instead of sending it straight to Elastic. The Collector can still forward data to Elastic, so dashboards keep working. But it can also send the same data to Grafana or another backend.
This lets you run both systems in parallel. Teams can build and test Grafana dashboards without losing the existing setup.
You might wonder whether to jump straight from Elastic to Grafana, skipping the “parallel” phase. It’s possible, but more risky. If Elastic is already in production, keeping it during the transition gives your team a safety net. On top of that, the Collectors make it easy to run both in parallel, so there’s no need to take unnecessary risks.
Phase 3 – Switch the Backend
Stop sending data to Elastic. Now everything goes to Grafana (or any other backend). The services don’t change — they still send telemetry through OTel. That’s the real payoff: the backend becomes a decision you can change later without re-instrumenting services.
Part 6 – Cost Management and Observability Economics
Initial Cost Impact
As soon as you start collecting more data with OpenTelemetry, costs become part of the conversation. More services = more telemetry = higher initial costs
Why Costs Rise
With the old Elastic agent, some services weren’t sending full telemetry. For example, background workers or Kafka consumers often didn’t show up. Elastic runs on an annual credits model. As soon as OTel agents were in place, the services began sending a lot more data — not just API calls but background workers, Kafka transactions, event hubs, all of which the old Elastic agent never captured. At some point, the cluster has to be scaled to the next tier, which makes the bill go up.
Retention Strategy
That leads to the question of retention. How long do we actually need to keep detailed data?
For infrastructure troubleshooting, usually a short window is enough — maybe a month of logs and metrics. But business metrics are different. If you want to see tenant growth or workflow performance over time, you might need to look back six months or a year.
You end up with two levels of retention:
- Short-term detailed data for debugging and support,
- Long-term aggregated data for business analysis and planning.
So, we can say that OpenTelemetry forced a distinction between operational telemetry (short-term) and business telemetry (long-term).
The “Summary After Three Months” Strategy
What if you want the system to retain the insights but without the cost of long-term raw data storage? An option here might be to keep detailed telemetry for three months, then roll it up into summaries. For example:
- Instead of keeping every single file upload record, store monthly totals per tenant.
- Instead of keeping every trace, store latency distributions.
Of course, cutting data too aggressively has risks. If you reduce retention for infrastructure logs, troubleshooting becomes harder. If you keep too much, costs spiral. The balance depends on how much you value historical debugging vs. business reporting.
Backend Choices Affect Cost
The backend also makes a difference. Elastic is strong but becomes expensive for long-term storage. Grafana with Prometheus or Loki is generally cheaper and more flexible if you want to keep historical data.
A common setup is:
- Elastic for short-term, detailed troubleshooting data,
- Prometheus/Grafana for long-term metrics and trends.
Cost vs. Value Balance
So costs don’t disappear with OpenTelemetry. In fact, in the beginning you might see them go up because you’re finally collecting more complete data. The value is that you have the flexibility to decide what to keep, what to aggregate, and which backend to use.
Part 7 – Pros, Cons, and Trade-offs
OpenTelemetry gives you clear benefits, but it’s not free of challenges. Like most technology choices, it comes down to trade-offs.
The Advantages
| Pros | Details |
| Vendor neutrality | Instrument once with OTel, and you can send data wherever you want: Elastic today, Grafana tomorrow, Datadog if needed. You can even send it to multiple backends at the same time. |
| Cross-team consistency | Instead of each team doing observability in its own way, everyone uses the same model of metrics, traces, and logs. This way, scaling and cross-team work are much easier. |
| Deeper visibility | OTel agents capture not only APIs but also workers, Kafka, event hubs, and background processes — all the places the Elastic agent used to miss. Combined with custom business metrics, you end up with a far richer view of the system. |
The Challenges
| Cons | Details |
| Management overhead | With a SaaS tool like Datadog or New Relic, you install the agent and the vendor handles the rest. With OTel, you own the Collector, the pipelines, the backends, the retention policies. |
| Requires observability stack ownership | You need people to run and maintain the observability stack, not just developers to add instrumentation. |
| Higher initial learning curve | Teams need to understand the architecture, configuration, and best practices before getting full value. |
The Trade-off Decision
So the trade-off is clear:
- SaaS = convenience, but you’re tied to the vendor.
- OTel = independence and flexibility, but you manage more yourself.
Which path makes sense depends on priorities. If you value quick setup and don’t mind lock-in, SaaS works. If you want long-term control, OTel is the way forward, but you have to plan for the extra responsibility.
Wrap-up and Conclusion
OpenTelemetry is the common layer underneath monitoring. Teams adopt it for two main reasons: freedom and visibility.
The trade-off is that you have to manage more yourself. But that effort pays off with long-term control.
Migration to OpenTelemetry doesn’t have to be risky. As shown earlier, it’s a step-by-step process rather than a “big bang.” Each step is small and reversible.
Looking forward, OpenTelemetry is the industry’s standard: tools like Sentry already integrate with OTel, and all major vendors have adopted it. So, it’s clear where the industry is heading.
Then, the bottom line is this: OpenTelemetry isn’t a question of if, it’s a question of when. The sooner your team adopts it, the sooner you get both vendor independence and the business-level visibility.
Contact us today. Ready to implement, verified templates for monitoring services and applications. We build and manage your observability and availability.
Sources:
- CNCF Landscape: CNCF Project Page
- B3 Propagation: GitHub: openzipkin/b3-propagation
- Traces: OTEL Tracing Docs
- OTEL Architecture Guide: OpenTelemetry Documentation
- Grafana Tempo Docs: Span Metrics
- Collector Processors: opentelemetry-collector-contrib
- OpenTelemetry Roadmap: https://opentelemetry.io/community/roadmap/
- internal sources